
The Clean Water Act Just Turned 50. How Is It Doing?
- May 4, 2022
- 5 min read
by Diane Rosenberg, JFAN Executive Director

Fifty years ago it became crystal clear that American’s waterways were in dire straits. Fires on Ohio’s Cuyahoga River, a blazing oil slick in downtown Cleveland, reeking sewage wafting from Washington, DC’s Potomac River, and enormous fish kills in several large lakes appalled the nation. Forced to address the pollution crisis, Congress passed the ambitious Clean Water Act of 1972 (CWA), a hallmark piece of environmental legislation.
The CWA was designed to prevent, reduce, and completely eliminate water pollution by 1985. A new report by the Environmental Integrity Project, “The Clean Water Act at 50: Promises Half Kept at the Half-Century” examines the state of the nation’s waterways, 37 years past the CWA’s original target date, and recommends solutions to help it meet its goal.
A Roadmap to Clean Water
Enforceable regulations changed the way industries and wastewater treatment plants, termed “point sources”, discharged contaminates into waterways. Failing to meet regulations became a federal offense carrying hefty fines with enforcement assigned to the U.S. Environmental Protection Agency (EPA).
Technology-based systems were to be developed and updated every five years in order to eliminate pollution by 1985. In the interim it became unlawful to discharge pollutants into waterways unless a National Pollutant Discharge Elimination System (NPDES) was submitted and approved. NPDES permits restricted the amount of contaminates that could be dumped into waterways, and industry-specific limits were developed. NPDES permits were designed to be a stopgap measure until technology-based systems could end the pollution problem.
States were now required to analyze samples of their waterways and every two years submit to the EPA a 303(d) list of “impaired” waters, those too polluted to be used for their intended purposes. One trillion dollars was made available for local municipalities to upgrade their sewage treatment plants.

For the first 30 years, the CWA generated substantial improvements in water quality. An additional 16,507 miles of rivers and streams once again were swimmable, and fish in an additional 24,700 became safe for consumption.
Yet in 2022, the CWA has much to do to meet its overdue goal. Today about half of US rivers, streams and lake acreage are classified as impaired, too polluted for swimming, recreation, aquatic life, fish consumption or drinking. And that’s not the full story as significant numbers of waterways aren’t regularly assessed. In Iowa, for example, only half were tested over the last two years.
Why Did the Clean Water Act Miss Its Target?
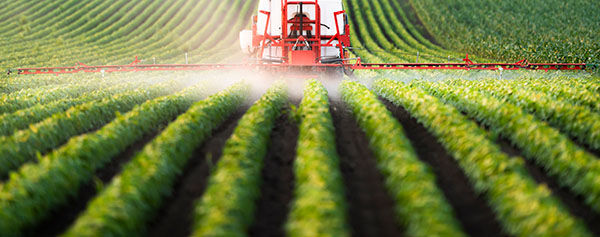
Many impediments hinder the CWA from meeting its goals. There are nearly nonexistent controls for “non-point source” pollution – primarily runoff from agricultural fields as well as suburban lawns, and parking lots. This was designed partially to allow states and municipalities local control and partly because of strong resistance from the powerful food lobby.
As a result, today the brunt of water pollutants comes from non-point agriculture runoff.
The lack of EPA and state authority to enforce cleanup and pollution reduction plans, called Total Maximum Daily Loads, further weakens its effectiveness. Instead these plans are primarily led by volunteer efforts and lack sufficient substance and oversight.

States are given little power to stop interstate water pollution. A prime example of this failure is the Gulf of Mexico dead zone, the product of nitrogen and phosphorus pollutants draining from 12 Midwest farming states, including Iowa. States also develop their own systems of water monitoring and may also have different standards for determining what constitutes pollution, impeding a unified and efficient approach.
Federal enforcement of CWA provisions is weak, relying primarily on states agencies to implement the CWA, issue permits, and monitor enforcement. Budget cuts have also reduced the EPA and state agencies’ ability to enforce permit requirements.
The EPA and many state agencies also fail to maintain accurate, up-to-date records of livestock confinements or pollution violations. In Iowa, for example, the Department of Natural Resources discovered 5,000 previously unknown factory farms in 2017 while doing a comprehensive survey for the EPA.
The EPA has also not kept up with a critical component for the CWA’s success: updating technology-based standards to eliminate water pollution. Decades have passed without modernizing these necessary standards.
How Bad Is It?
The EIP looked at water quality data from 303(d) lists of impaired waters for each state. In a nutshell the data revealed:
Rivers: 1,401,320 miles assessed; 703,477 miles impaired; 50% impairment
Lakes, Ponds and Reservoirs: 20,403,021 acres assessed; 11,168,767 impaired; 55% impairment
Bays, Estuaries and Harbors: 46,557 square miles assessed; 19,470 miles impaired; 25% impairment
How Does Iowa Fare?
As we reported last month, Iowa’s waterways are not in good shape. The EIP report documents Iowa as one of the leading states with a high percentage of its waters impaired. Among all 50 states Iowa ranks:
4th for impaired rivers and streams used for swimming and recreation.
4,553 miles or 93% of all those assessed are impaired.
3rd for impaired lakes used for swimming and recreation.
68,735 acres or 83% of all those assessed are impaired.
7th for impaired rivers for any use.
6,919 miles or 84% of all those assessed are impaired.

With over 30 million acres of land used for farming – 85% of Iowa’s total acreage –
and 23 million hogs producing as much liquid sewage as 83 million people, it’s not hard to see why Iowa’s water quality problem is not under control.
So What Needs to Be Done?
The EIP recommends several courses of action:
The EPA must again comply with CWA requirements and mandate frequent updates to technology-based systems for industries and agriculture.
Congress must pass legislation strengthening the CWA to include pollution from all “non-point sources”, now the largest contributor to the nation’s dirty waters. The vast majority of non-point source pollution is agriculture. Industrial livestock production should be regulated as other large industries are.
Federal legislation or EPA rulemaking should establish one set of guidelines for measuring pollutant levels to be used by all 50 states.
Cleanup plans – the Total Maximum Daily Loads – must be easier to enforce.
Adequate amounts of state funding from the Bipartisan Infrastructure Bill should be directed into improving water quality, especially in lower-income communities of color, which are disproportionately impacted by industrial and agricultural pollution.
Funding must be increased for the EPA and state water quality agencies in order to fully measure, develop and administer plans that will clean up the nation’s waterways.
The EPA should set interim goals by decade and develop enforceable plans to achieve the original goal of the CWA.

The Clean Water Act achieved significant progress over the last 50 years. It eliminated flaming rivers and revived many waterways. While the CWA has fallen far short of its goal of eliminating water pollution by 1985, there is still much that can and must be done to reach it. Gathering the political will to strengthen the EPA and its ability to effectively administer the CWA is essential. Every
American has the basic human right to clean water. It’s time we all did.
Read the Environmental Integrity Project’s The Clean Water Act at 50. The report contains informative data on the condition of waterways in all 50 states.

Comments